2D Views
Image data
You should note that the fastest, and in many cases standard, way of visualizing volumetric image data is by extracting orthogonal slices that are cut through the volume in different planes using a technique known as multi-planar reformatting (MPR). A 3D Cursor is available in Track mode to link the different axis representations of volumetric data, which are color-coded for easy identification. In addition to being able to extract slices orthogonal to the coordinate axes, Dragonfly also provides an opportunity to slice volumetric image data in arbitrary orientations. An oblique or double-oblique view may provide an image whose angulation matches that of the structure you need to study (see Creating Oblique Views). You can also go further by viewing structures in realistic 3D renderings (see 3D Views).
2D multi-planar scene views
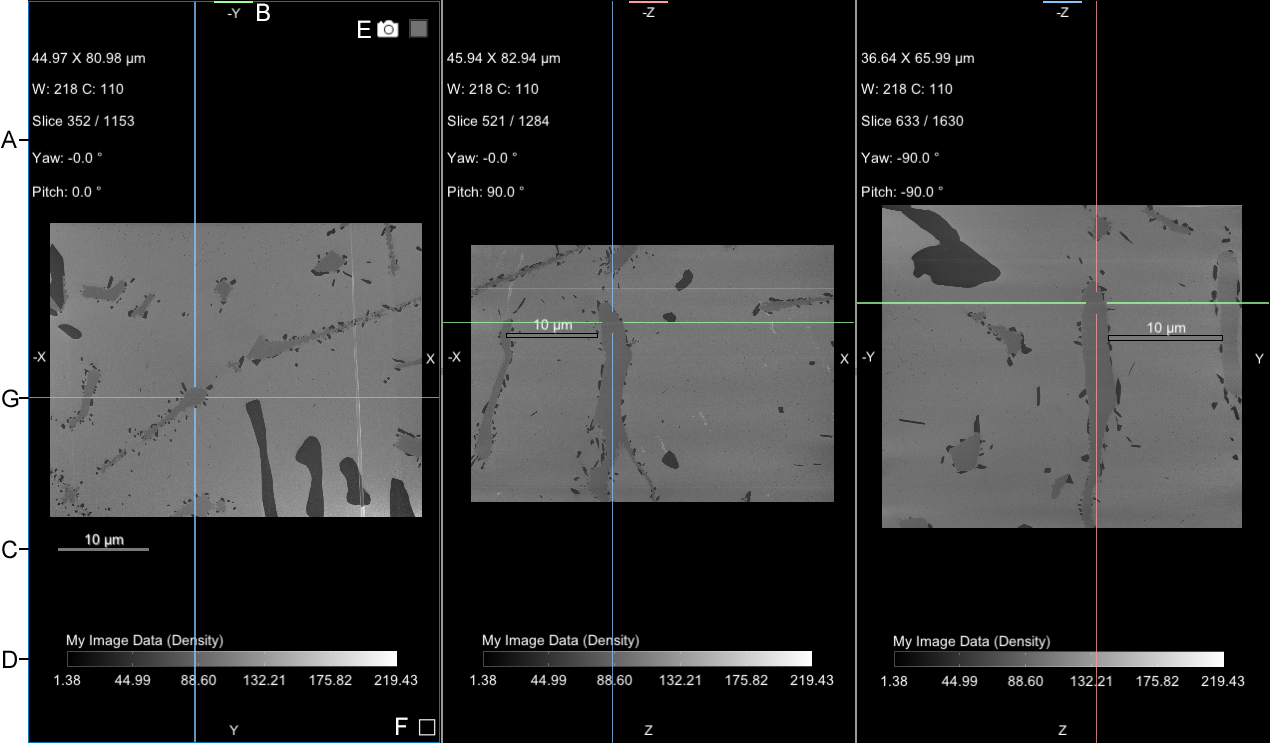
A. Text annotations B. Orientation indicators and axis colors C. Scale bar D. Legend E. Active view icons F. Marked slices box G. 3D cursor
The text annotations show information about each view, such as the applied zoom factor and selected orientation, as well as information about the currently selected dataset, such as the window level values and slice number in the image stack. These annotations are interactive and can be used to adjust the view, as described in the following table. See Selecting the Fonts Preferences for information about customizing the appearance of the text annotations.
| Description | |
|---|---|
| Zoom |
Indicates the current dimensions of the view, as calculated for the selected object.
|
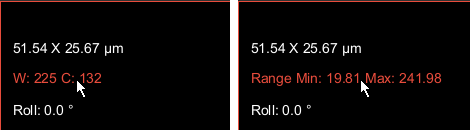
| Window Leveling |
Indicates the current window leveling applied to the selected image data. You can choose to display the window width (W) and window center value (C), as shown below on the left, or the minimum and maximum values of the selected range, as shown below on the right. These options are available as a preference (see Miscellaneous Preferences).
|
| Slice |
Indicates the current slice and the total number of slices in the selected object for the displayed axis representation.
|
| Time Step | Available for time-enabled image data only, the Time Step text annotation indicates the currently selected time step and lets you navigate between time steps. |
|
View Rotations (Yaw, Pitch, and Roll) |
Indicates the current orientation of the view, which is represented by the so-called Euler angles named Yaw, Pitch, and Roll (see Scene View Orientation for more information about view angles).
Yaw… Indicates the angle of the vertical X-axis of the view in the world coordinate system. Drag the annotation left or right to change the rendering angle. Pitch… Indicates the angle of the horizontal Y-axis of the view in the world coordinate system. Drag the annotation up or down to change the rendering angle. Roll… Indicates the angle between the longitudinal Z- axis of the view in the world coordinate system. Drag the annotation up or down to change the rendering angle. |
2D views include markers at the top, bottom, and sides that indicate the orientation of the view. In addition, axis representations are color-coded. This color coding is also applied to the crosshair of the 3D Cursor (see Using the 3D Cursor) and in the Slice Analysis panel (see Slice Analysis).
Floating scale bars are available for 2D views to show the relative size of objects. If required, you can re-position the scale bar by dragging it anywhere inside a view.
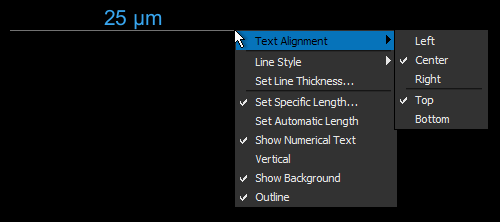
The appearance and orientation of scale bars views can be customized through a contextual menu and set in the Annotations preferences (see Selecting the Annotations Preferences).
| Description | |
|---|---|
| Text Alignment | Lets you choose how text is aligned. Text can be aligned left, center, or right horizontally, as well as vertically on the top or bottom of the scale bar. |
| Line Style | Lets you choose a line style that has no hash marks, end hash marks, or half hash marks. |
| Set Specific Length | Lets you choose a specific length for the scale bar. |
| Set Automatic Length | Sets the length of the scale bar so that it automatically adjusts to the size of the view. |
| Show Numerical Text | If selected, shows the length of the scale bar. |
| Vertical | If selected, aligns the scale bar vertically. |
| Show Background | If selected, a semi-transparent background will be added to the scale bar. |
| Outline | If selected, an outline will be added to the background of the scale bar. |
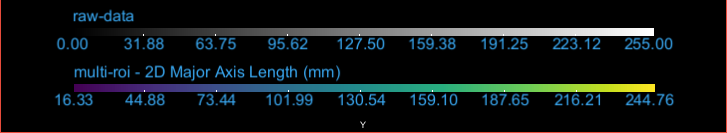
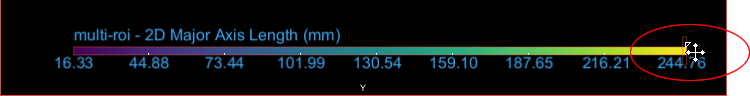
Legends are available for 2D views to show how values are mapped to the grayscale tones of selected image data or to the colors of selected scalar data. If required, you can re-position legends by dragging them anywhere inside a view, as well as change their orientation and size.
Legends
Do the following to change the orientation and/or size of a legend:
- Right-click the legend and then choose Vertical or Horizontal in the pop-up menu.
You can choose a default orientation for legends in the 2D Settings preferences (see Selecting the 2D Settings Preferences).
- Drag from the start or end point of a legend, as shown below, to change its width or height.
Two active view icons — Camera and View — are available for the current 2D view.
- The Camera
 icon lets copy a screenshot of the current view to the clipboard (see Copying Screenshots to the Clipboard).
 - The View
 icon lets you drag the display's GUID to the Python Console.
The Marked Slices box, which appears at the bottom right of image plane views of selected datasets, can be used to create a key image within an image stack. Functions implemented for marked slices include interpolation, replacement, and removal of unrepresentative slices in an image stack, as well as extracting new datasets from marked slices (see Marking Slices and Modifying Image Stacks).
The 3D Cursor, which appears in Track mode, can be used to synchronize the MPR views within a scene to the crosshair intersection. This can help you to quickly locate a point in 3D space (see Using the 3D Cursor for additional information about the 3D Cursor).
A right-click or pop-up menu for 2D views provides easy access to simple manipulations and commands, such as flips, rotations, and exporting screenshots, as well as for selecting different views.
| Description | |
|---|---|
| 3D | Changes the selected view to 3D mode (see 3D Views). |
| XY | Changes the selected view to the XY axis representation. |
| XZ | Changes the selected view to the XZ axis representation. |
| YZ | Changes the selected view to the YZ axis representation. |
| Image Plane | Changes the selected view to the image plane representation. This is the plane in which the data was acquired. |
| Orthogonalize Other 2D Views | When selected for a view in Oblique mode, automatically orthogonalizes other 2D views in the current scene (see Creating Oblique Views). |
| Set Slab Thickness* | Opens the Enter a New Slab Thickness dialog, in which you can enter the required slab thickness for a view that is in Slab mode (see Viewing Images in Slab Mode). |
| Start Slice Analysis | Opens the Slice Analysis panel, in which you can compute a range of measurements for each slice within a dataset and for the dataset as a whole (see Slice Analysis Panel and Measurements). |
| Export Screenshot of View | Lets you export a screenshot of the view. The size of the exported screenshot is selectable in the Screenshot Size dialog. |
| Export Screenshot of All Views | Lets you export a screenshot of all views. The size of the exported screenshot is selectable in the Screenshot Size dialog. |
| Flip/Rotate | Flips and rotates the view (see Flipping and Rotating Views). |
| Show Marked Slices Indicator** | Toggles the visibility of the Marked Slices Indicator, which appears only on image plane views. Refer to Items Available for Image Plane Views for information about the menu items available for marked image slices. |
| Default View | Changes the selected display to its assigned default view. For example, if you change the view assigned to the XY axis representation to 3D and then choose Default View, the XY axis representation should re-appear. |
* Available for views in Slab mode only.
** Available for image plane views only.
The following additional menu items are available for image plane views.
| Description | |
|---|---|
| Show/Hide Marked Slices Indicator | Toggles the visibility of the Marked Slices Indicator (see Marking Image Slices). |
| Mark All Slices | Marks all slices in the image stack (see Marking Image Slices). |
| Unmark All Slices | Unmarks all slices in the image stack (see Marking Image Slices). |
| Mark slices | Lets you mark a range of image slices (see Marking Image Slices). |
| Copy Marked Slice to Current Slice | Lets you copy a marked slice to the current image slice (see Copying Marked Slices). |
| Remove All Marked Slices | Removes all marked slices in an image stack (see Removing Image Slices). |
| Simple Marked Slices Replacement | Interpolates marked slices in an image stack (see Interpolating Image Slices). |
